Prometheusのcannot allocate memory エラーの調査と解消
弊プロジェクトでprometheusのあるエラーログから発生するメモリリークによりPodが再起動を繰り返す事象に悩まされたが解消できたので経緯も含めてナレッジとして共有。
弊プロジェクト × prometheus
弊プロジェクトではkubernetes上で稼働するコンテナのメトリクスをprometheusで収集している。
- prometheusも例外なくkubernetest上で動くpodの1つ。
- モニタリングはstackdriverを利用しているのでstackdriver-prometheus-sidecarをサイドカーに置いてメトリクスをstackdriverに送っている。
Diskサイズ逼迫の考慮が裏目に出た
prometheusはローカルストレージを選択して /dataに蓄積されるメトリクスの保存期間を短くしていた。理由は以下。
- podのdisk利用量を抑える
- sidecarでstackdriverにメトリクスが流れるのでpod内にメトリクスを長時間保持しておく必要がない
この保存期間を短くする設定が影響して /dataのデータがrotationされずメモリリークを起こしていた。
発生していた事象
- prometheusは収集したメトリクスを一定期間ごとにブロックディレクトリを作成して分割していく。
- 前述したとおりデータを長く保持する必要がないので保持期間の設定を短くしていたが実際には期限切れのデータが消えていなかった。(rotationされていなかった)
- 徐々にブロック内のデータが大きくなりrotation時に利用するメモリが肥大化したことが原因と予想される
次のようなエラーログとともにpodのメモリ利用量も右肩上がりになっていた。
1 2 3 4 5 6 7 8 9 |
prometheus-594bfd55b9-rxt49 prometheus level=info ts=2020-01-16T05:40:45.459Z caller=compact.go:496 component=tsdb msg="write block" mint=1579142443621 maxt=1579147200000 ulid=01DYPDWG2C1TT3105NWEP2868P duration=1.223390137s prometheus-594bfd55b9-rxt49 prometheus level=info ts=2020-01-16T05:40:45.536Z caller=head.go:668 component=tsdb msg="head GC completed" duration=15.595659ms prometheus-594bfd55b9-rxt49 prometheus level=info ts=2020-01-16T07:00:00.921Z caller=compact.go:496 component=tsdb msg="write block" mint=1579147200000 maxt=1579154400000 ulid=01DYPJDMT1VB1VYVSJAB3ZPRNB duration=471.478236ms prometheus-594bfd55b9-rxt49 prometheus level=info ts=2020-01-16T07:00:01.019Z caller=head.go:668 component=tsdb msg="head GC completed" duration=17.038266ms prometheus-594bfd55b9-rxt49 prometheus level=info ts=2020-01-16T09:00:00.969Z caller=compact.go:496 component=tsdb msg="write block" mint=1579154400000 maxt=1579161600000 ulid=01DYPS9BZFYVEBXY6F687EKNT8 duration=602.45951ms prometheus-594bfd55b9-rxt49 prometheus level=info ts=2020-01-16T09:00:01.095Z caller=head.go:668 component=tsdb msg="head GC completed" duration=33.646921ms prometheus-594bfd55b9-rxt49 prometheus level=error ts=2020-01-16T11:00:00.663Z caller=db.go:609 component=tsdb msg="compaction failed" err="persist head block: write compaction: write chunks: cannot allocate memory" prometheus-594bfd55b9-rxt49 prometheus level=error ts=2020-01-16T11:00:01.938Z caller=db.go:609 component=tsdb msg="compaction failed" err="persist head block: write compaction: write chunks: cannot allocate memory" prometheus-594bfd55b9-rxt49 prometheus level=error ts=2020-01-16T11:00:04.261Z caller=db.go:609 component=tsdb msg="compaction failed" err="persist head block: write compaction: write chunks: cannot allocate memory" |
compaction failed” err=“persist head block: write compaction: write chunks: cannot allocate memoryのログが出力され始める。
Podのメモリ推移のグラフ以下のようになっていた。
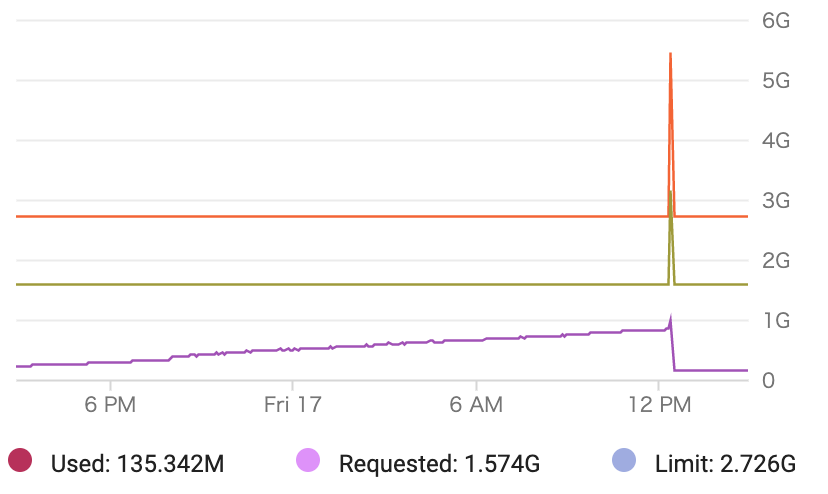
※12PMでPodの再デプロイをしている。
どうやって解消したか
事象発生時の起動オプション にはstorage.tsdb.retension.timeだけであったが追加でstorage.tsdb.min-block-durationも追加した。
|
|
prometheusのコードを見るとブロックディレクトリ内のmeta.jsonにあるmaxTimeを判定に入れていることがわかる。 https://github.com/prometheus/prometheus/blob/v2.9.2/vendor/github.com/prometheus/tsdb/db.go#L670
結果どうなったか
rotationのログも継続的に出力され「cannot allocate memory」のログも出なくなった
1 2 3 4 5 6 7 8 9 10 11 12 13 14 15 16 17 |
prometheus-cc56c76b9-xr4m8 prometheus level=info ts=2020-01-17T03:33:56.214Z caller=compact.go:496 component=tsdb msg="write block" mint=1579231582696 maxt=1579231800000 ulid=01DYRS0ZRTP623TZ0D32Y0VS5Y duration=1.62823461s prometheus-cc56c76b9-xr4m8 prometheus level=info ts=2020-01-17T03:33:56.281Z caller=head.go:668 component=tsdb msg="head GC completed" duration=11.920144ms prometheus-cc56c76b9-xr4m8 prometheus level=info ts=2020-01-17T03:37:30.765Z caller=compact.go:496 component=tsdb msg="write block" mint=1579231800000 maxt=1579232100000 ulid=01DYRS7JEF4CNMZ4HFZTN2ZE1S duration=445.699507ms prometheus-cc56c76b9-xr4m8 prometheus level=info ts=2020-01-17T03:37:30.866Z caller=head.go:668 component=tsdb msg="head GC completed" duration=18.677134ms prometheus-cc56c76b9-xr4m8 prometheus level=info ts=2020-01-17T03:42:30.863Z caller=compact.go:496 component=tsdb msg="write block" mint=1579232100000 maxt=1579232400000 ulid=01DYRSGQDGHQ7CDTJ0E8KM06VC duration=543.027584ms prometheus-cc56c76b9-xr4m8 prometheus level=info ts=2020-01-17T03:42:30.951Z caller=head.go:668 component=tsdb msg="head GC completed" duration=11.532145ms prometheus-cc56c76b9-xr4m8 prometheus level=info ts=2020-01-17T03:47:30.743Z caller=compact.go:496 component=tsdb msg="write block" mint=1579232400000 maxt=1579232700000 ulid=01DYRSSWCGAAPE51394D3KY3XM duration=422.910739ms prometheus-cc56c76b9-xr4m8 prometheus level=info ts=2020-01-17T03:47:30.839Z caller=head.go:668 component=tsdb msg="head GC completed" duration=11.107692ms prometheus-cc56c76b9-xr4m8 prometheus level=info ts=2020-01-17T03:52:30.777Z caller=compact.go:496 component=tsdb msg="write block" mint=1579232700000 maxt=1579233000000 ulid=01DYRT31BG73MQ9WWP7WX1WAFK duration=457.516201ms prometheus-cc56c76b9-xr4m8 prometheus level=info ts=2020-01-17T03:52:30.944Z caller=head.go:668 component=tsdb msg="head GC completed" duration=11.344277ms prometheus-cc56c76b9-xr4m8 prometheus level=info ts=2020-01-17T03:52:31.002Z caller=head.go:738 component=tsdb msg="WAL checkpoint complete" first=0 last=1 duration=58.11359ms prometheus-cc56c76b9-xr4m8 prometheus level=info ts=2020-01-17T03:57:30.836Z caller=compact.go:496 component=tsdb msg="write block" mint=1579233000000 maxt=1579233300000 ulid=01DYRTC6AGQZK6JHD1PRAKTSAV duration=516.794409ms prometheus-cc56c76b9-xr4m8 prometheus level=info ts=2020-01-17T03:57:30.941Z caller=head.go:668 component=tsdb msg="head GC completed" duration=11.109623ms prometheus-cc56c76b9-xr4m8 prometheus level=info ts=2020-01-17T04:02:31.116Z caller=compact.go:496 component=tsdb msg="write block" mint=1579233300000 maxt=1579233600000 ulid=01DYRTNB9F2KM13G3H1YW940V9 duration=796.974963ms prometheus-cc56c76b9-xr4m8 prometheus level=info ts=2020-01-17T04:02:31.179Z caller=head.go:668 component=tsdb msg="head GC completed" duration=11.698745ms prometheus-cc56c76b9-xr4m8 prometheus level=info ts=2020-01-17T04:02:31.265Z caller=head.go:738 component=tsdb msg="WAL checkpoint complete" first=2 last=3 duration=86.160389ms prometheus-cc56c76b9-xr4m8 prometheus level=info ts=2020-01-17T04:07:30.826Z caller=compact.go:496 component=tsdb msg="write block" mint=1579233600000 maxt=1579233900000 ulid=01DYRTYG8GDY8EWN7ZABHJVV7C duration=506.455293ms |
/dataディレクトリのログデータもrotationしている
1 2 3 4 5 6 7 8 9 10 |
/data $ ls -al total 8 drwxrwsrwt 6 root 2000 160 Jan 17 06:07 . drwxr-xr-x 1 root root 4096 Jan 17 03:26 .. drwxr-sr-x 3 1000 2000 120 Jan 17 05:57 01DYS17XJGQBR3010JG02ZHZ4N drwxr-sr-x 3 1000 2000 120 Jan 17 06:02 01DYS1H2HF6A6TB3Y97NHB6A26 drwxr-sr-x 3 1000 2000 120 Jan 17 06:07 01DYS1T7GN72M2ZAZ2NEK1C96B -rw-r--r-- 1 1000 2000 0 Jan 17 03:26 lock -rw-r--r-- 1 1000 2000 20001 Jan 17 03:26 queries.active drwxr-sr-x 3 1000 2000 180 Jan 17 06:07 wal |
01DYS17xxxxxのディレクトリが複数ある。
Podのメモリも安定
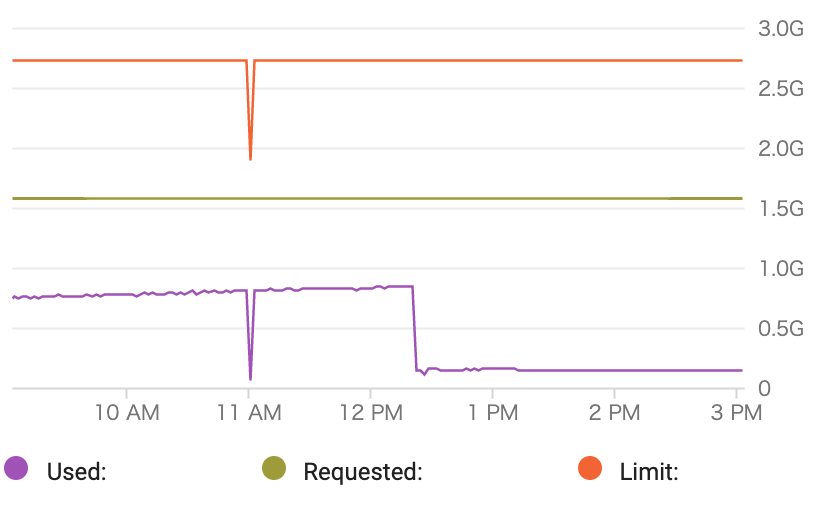
※12PM以降に対策を入れた新しいPodをデプロイしている。